T test
Use case
Determine if our guess/prediction/hypothesis is significant.
Examples
One-sample t-test:
-
[Toss coin expl] If we toss a coin 100 times with 60 heads, can we trust it to be a fair coin?
-
[Pearson expl] Given two sequence x (feature) and y (label), we can compute Pearson correlation r. Assume r is high (e.g., 0.8), how do we trust this result, what if both sequences are actually randomly sampled and this is just a coincidence? In other words, how to know if this result is significantly different compared with “assuming x and y are randomly sampled”? How confident are we about the result?
Two-independent-sample t-test:
- [Two independent sample mean expl] We are given two sequence a and b which may be sampled from the same one-dimensional random variable. E.g., we get 13 samples in a~[1, 3, 4, 6, 11, 13, 15, 19, 22, 24, 25, 26, 26] and 11 samples in b~[2, 4, 6, 9, 11, 13, 14, 15, 18, 19, 21], can we trust their means are actually the same?
Moving to t-distribution
- Know population mean
Know population std
Intuitively, we are saying when we can not get population std, we use sample std instead.
\[t = \frac{\bar{X}-\mu}{S/\sqrt{n}}\]- \(\bar{X}\): sample mean
- \(\mu\): population mean
- \(S\): sample std
- \(n\): sample size
- \(t\): t score
But since we replaced the population std with sample std, t score is not a standard normal distribution anymore, it now follows the student’s t-distribution. The reason for this is beyond the scope of this post, but anyway, student’s t distribution is very much like Gaussian distribution, but only need one parameter (degree of freedom) instead of two in Gaussian (mean and std).
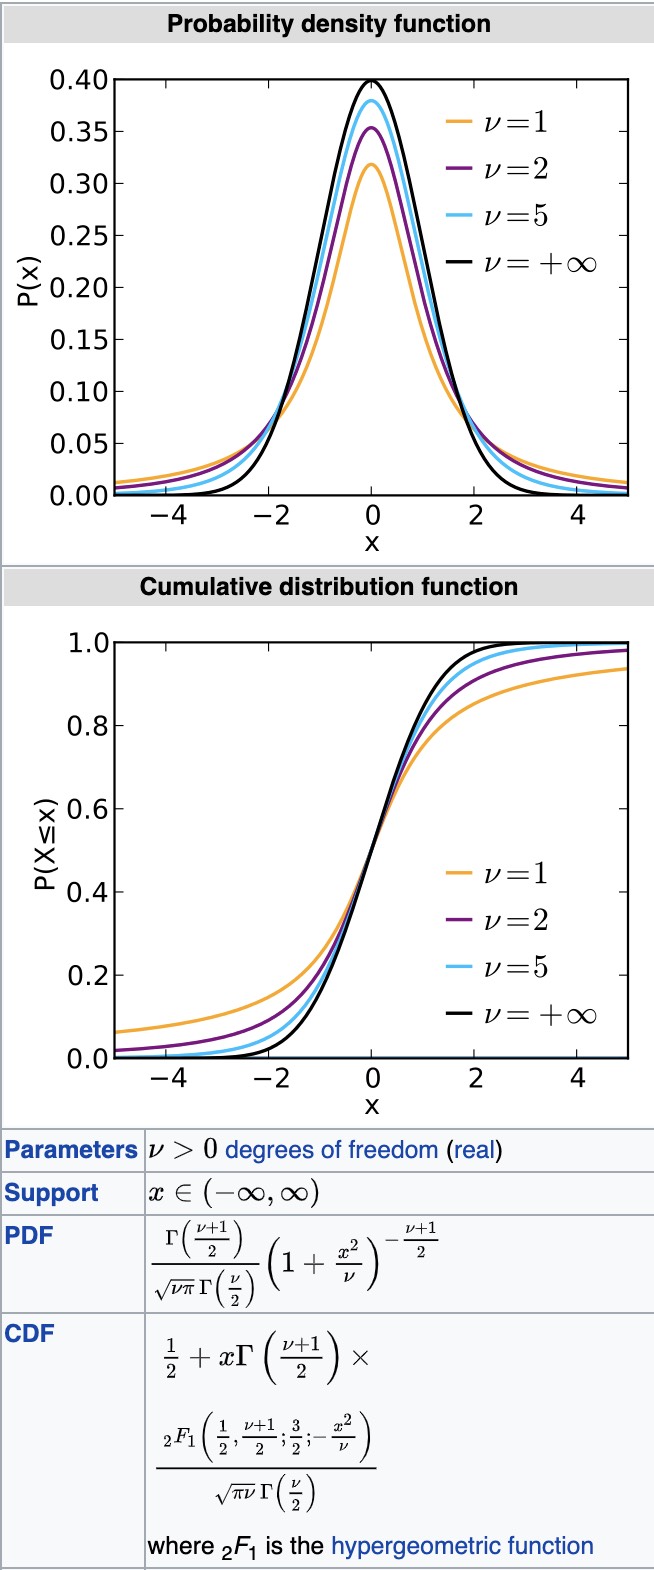
As you can see, student’s t distribution is defined by some complicate function called gamma function, which is beyound the scope of this post. But scipy in Python has already prepare this for us. Similar to z-test, we care about the cumulative distribution function (cdf) output, which tells us how like the event score will happen.
So in real world, all we need to do is
- Know population mean beforehand.
- Do the experiment, collect sample size, sample mean, and sample std.
- Compute t score
- Compute cdf output (scipy.stats.t.cdf or just look up it in the t-table)
The rest is the same as z-test, so I will conclude the post here.
Let’s try some examples
[Patient recovery expl] Researcher thinks that if knee surgery patients go to physical therapy twice a week (instead of 3 times), their recovery period will be longer. Average recovery times for knee surgery patients is 8.2 weeks, experiemnt result on 40 patients shows the average is 8.3 weeks and std is 0.5 weeks.
Here, the accepted fact is \(\mu=8.2\), researcher hypothesizes “\(\mu>8.2\) when therapy twick a week”. So the null hypothesis is “\(\mu=8.2\) when therapy twice a week”. In other words, twice a week has no effect, the patients still only need 8.2 weeks to recover. And we are computing under the null hypothesis, how likely (probability) the result (8.3 weeks over 40 patients) will happen?
- Knows:
- pupulation mean = 8.2
- pupulation std = ?
- sample size = 40
- sample mean = 8.3
- sample std = 0.5
- Goal:
- If the sample mean is significant
do NOT know population std => T-test
\[t = \frac{8.3-8.2}{0.5/\sqrt{40}} = 1.26\]Compute the p-value, we need also know degree of freedom, in this case, it will be 40-1=39, because we know sample mean, so not all 40 points are free, only 39 are free.
1 - scipy.stats.t.cdf(1.26, 39) # or scipy.stats.t.sf(1.26. 39)
# output: 0.1076
So if we pre-selected alpha=0.05, p>alpha, we are at least 95% sure to accept the null hypothesis, in other words, the result is NOT significant.